
Every Monday morning, in thousands of SMEs, someone opens Excel, copies data from the ERP, updates tables, reformats charts, and emails the report to the boss. Every week, the same hours wasted. Every week, the same delayed data. Manual business reporting is one of the biggest time drains in small businesses.
Yet the solution exists: automate reporting with a business dashboard that updates itself. In this guide, we'll show you how, what tools you need, and how much you'll actually save.
The problem with manual reporting
Manual business reporting has three structural flaws:
- Time: preparing a weekly report takes 2-4 hours. Multiply by 52 weeks = 100-200 hours/year spent copying and pasting data
- Delay: by the time the report is ready, data is already 1-5 days old. Decisions are based on the past, not the present
- Errors: every manual copy-paste is a risk. One wrong cell reference in an Excel formula can skew the entire report without anyone noticing
The result? Management makes decisions on old, potentially wrong data, while someone on the team loses a morning doing work that software could do in seconds.
Report vs business dashboard: what's the difference?
First, let's clarify the terms:
A business report is a static document — PDF, Excel, presentation — that captures data at a specific point in time. You produce it, send it, read it. Done.
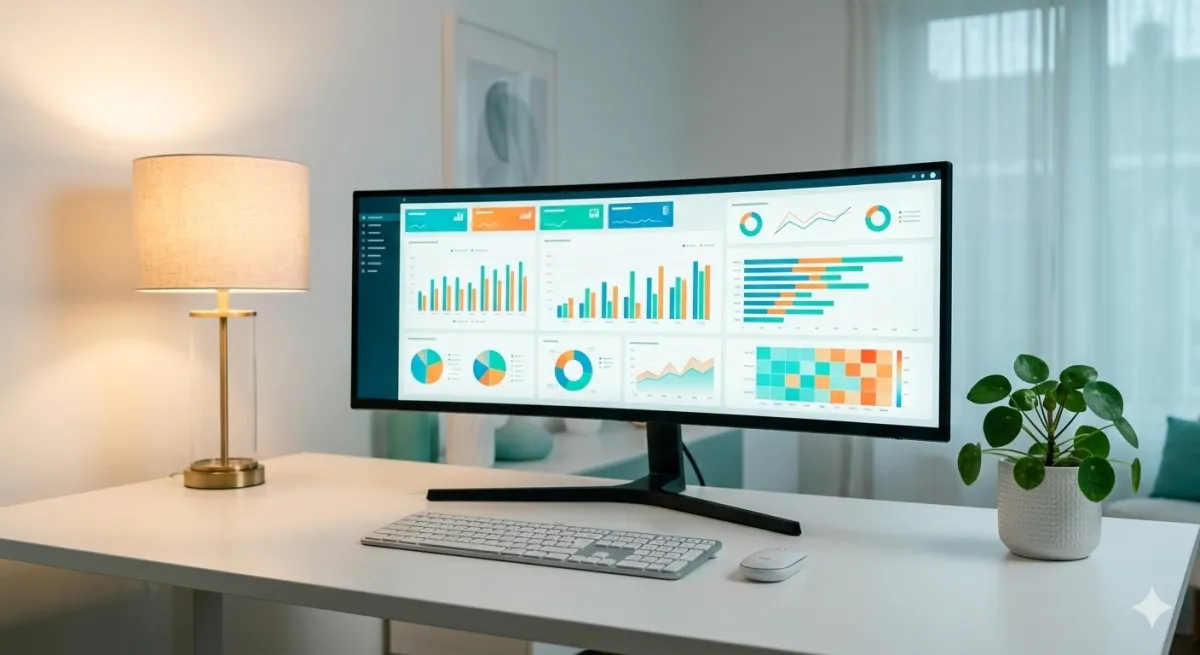
A business dashboard (or Business Intelligence dashboard) is an interactive interface that shows data in real time. You filter by date, click to drill down, compare periods. Data updates itself.
The fundamental difference: you produce the report; the dashboard works for you.
What to automate (and what not to)
Not all reporting should be automated. Here's a practical rule:
Automate immediately
- Weekly/monthly sales reports: revenue, margins, commercial KPIs — most requested and most repetitive
- E-commerce monitoring: orders, conversions, AOV, top products — data is already digital and easy to integrate. Read our BI guide for e-commerce
- Management reports: the CEO wants to see numbers every morning, not wait for Friday's report
- Budget vs actual comparisons: variances requiring immediate attention
Keep manual (for now)
- One-off ad hoc analyses (exploratory, not recurring)
- Reports with strong narrative content (comments, qualitative interpretations)
- Presentations for clients or investors (require custom design)
How to build an automatic reporting system
The process is simpler than you think. Four steps:
1. Identify your data sources
Where does your data come from? ERP (SAP, Mago4, TeamSystem), e-commerce (Shopify, WooCommerce), CRM, Excel spreadsheets, databases. Take inventory: each source is a "pipe" that the reporting system needs to connect.
2. Define essential reports
Don't start with 20 reports. Start with the 2-3 you actually use every week. For most SMEs: sales report, margin report, performance by product/agent/channel.
3. Choose the right tool
Modern Business Intelligence tools transform manual reporting into automatic dashboards. For SMEs, the key criteria are: ease of use, connection to your ERP, affordable cost. Read our data analysis software comparison for a complete overview.
4. Start small, expand later
Set up the first dashboard with the 5-7 most important KPIs. Use it for 2-4 weeks. Then add the next views. This incremental approach reduces risk and accelerates ROI.
Real benefits of automatic reporting
The benefits aren't just theoretical. Here's what changes in a typical SME:
| Metric | Before (manual) | After (automatic) |
|---|---|---|
| Report preparation time | 4-8 hours/week | 0 (automatic) |
| Data freshness | 3-5 day delay | Real-time |
| Error risk | High (copy-paste) | Zero |
| Data access | Only report creator | Entire authorized team |
| Historical comparisons | Difficult (different files) | One click |
Business reporting tools for SMEs
To move from manual to automatic reporting, you need BI tools that connect to your data sources. The main options:
- Excel + Power Query: a first step for those who want to stay in Excel but automate data import. Free with Microsoft 365, but limited for interactive dashboards
- Power BI / Tableau: powerful tools but requiring technical skills. Read our Power BI vs Tableau comparison
- Leviathan BI: designed for SMEs that sell. Pre-built business dashboards, direct ERP connection, setup in hours. Try it free
The advantages of a cloud solution are particularly relevant for reporting: access from any device, always-updated data, zero IT maintenance.
Conclusion
Manual business reporting is a hidden cost that SMEs underestimate. Hours spent every week copying data, delayed decisions, risk of errors — all of this has a price. For a specific focus on sales data, check out our sales analysis guide for SMEs.
Automating isn't complicated or expensive. Just choose the right tool, start with the most important reports, and build from there. To find the right solution for you, contact us for a personalized demo or read our guide on what is Business Intelligence.
Also discover how to integrate reporting into your management control system. For a complete implementation guide for your SME, check BI for SMEs: practical guide to getting started.
Related articles
BI Dashboards: How to Build an Effective One
Learn what Business Intelligence dashboards are, which KPIs to monitor, and how to build effective dashboards for your business without technical skills.

Excel Data Analysis: When to Switch to BI
Excel is great for starting out, but it has clear limits. Discover when it's time to switch to Business Intelligence and how to do it smoothly in your SME.
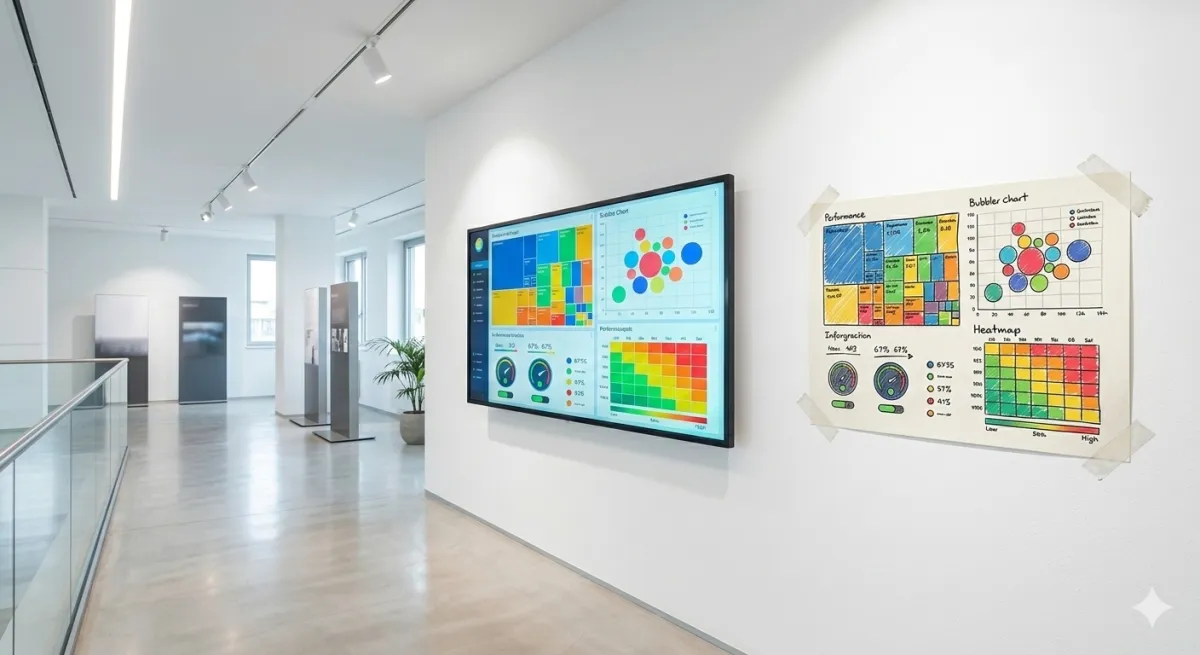
Data visualization: a guide to business charts for SMEs
Data visualization transforms raw numbers into immediate insights. Discover the 7 essential business charts, rules for effective visualizations, and mistakes to avoid.