Running an e-commerce without Business Intelligence is like driving at night without headlights. You have data everywhere — orders, customers, products, campaigns — but without a tool to organize it, you can't see where you're going.
In this guide, we'll see how BI can transform your online shop: what data to analyze, how to segment customers, and what decisions to make to increase sales and margins.
Why BI is crucial for e-commerce
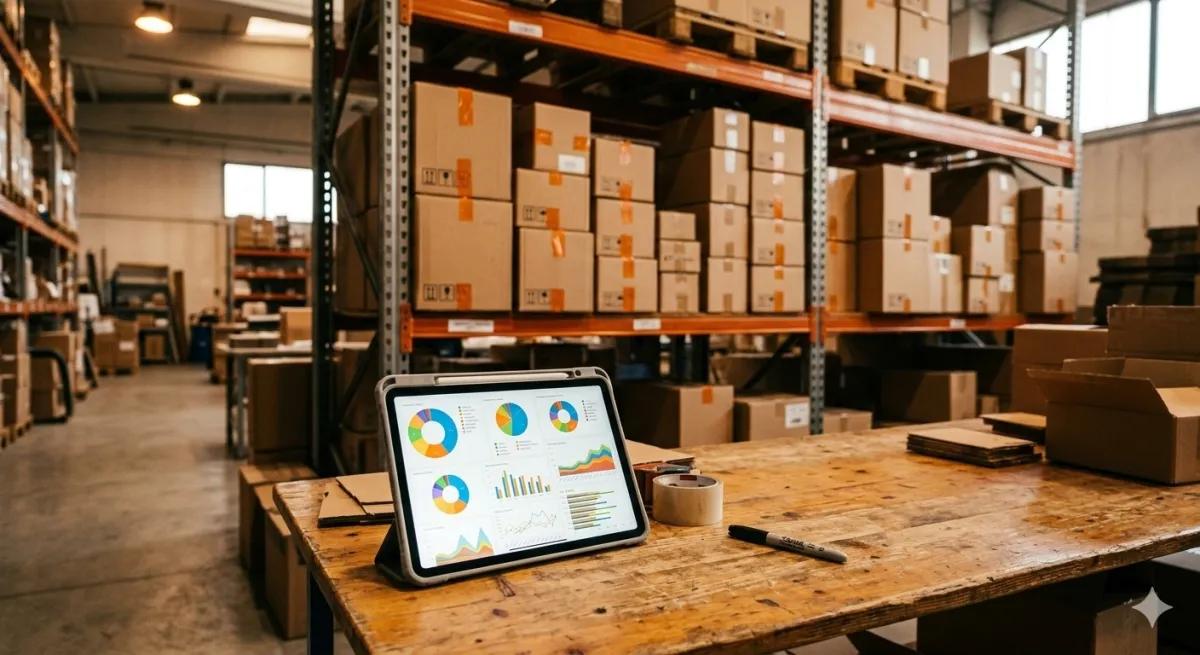
An e-commerce generates enormous amounts of data every day: visits, orders, returns, reviews, campaign clicks. The problem isn't lack of data, but the ability to interpret it.
Business Intelligence solves this by collecting data from all sources (e-commerce platform, analytics, ads, logistics) and presenting them in clear, actionable dashboards.
E-commerce metrics to monitor
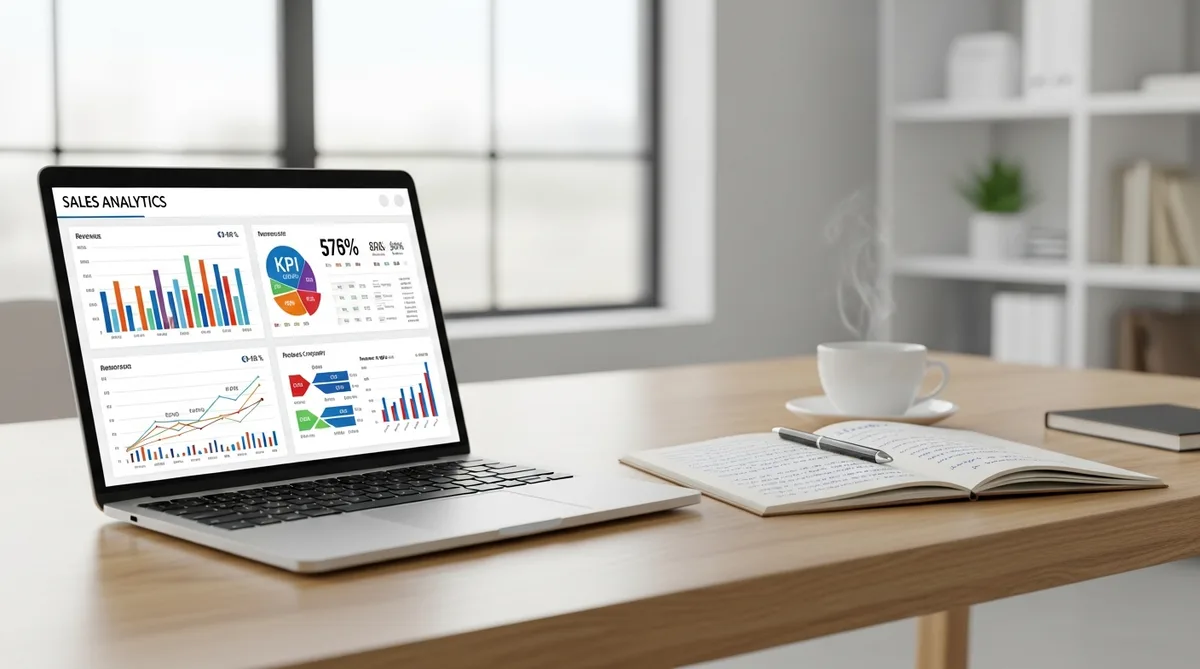
Sales performance
- Daily and monthly revenue with YoY comparison
- Order count and trends
- AOV (Average Order Value) by channel and segment
- Conversion rate from visit to order
- Abandoned carts and recovery rate
Product analysis
- Top sellers by volume and by margin (they don't always match)
- Low-rotation products tying up warehouse space
- Cross-selling: which products are bought together
- Return rate per product: a high return rate signals quality or description problems
Customer analysis
- New vs returning: how much revenue comes from loyal customers?
- Customer Lifetime Value (CLV): how much a customer is worth over time
- Purchase frequency: how often they come back to buy
- RFM segmentation: Recency, Frequency, Monetary — the most effective method to segment your customer base
Channel performance
- Revenue by channel: Google Ads, social, organic, email, direct
- ROAS (Return on Ad Spend) per campaign
- Acquisition cost (CAC) per channel
- Net margin by channel (after ad costs)
Customer segmentation with BI
Segmentation is where BI shows its true value. Instead of treating all customers the same way, you can identify groups with different behaviors:
RFM segmentation
The RFM method classifies customers on three dimensions:
- Recency: how long ago they last purchased
- Frequency: how many times they've purchased
- Monetary: how much they've spent in total
Combining these three factors, you can identify:
- VIP customers: buy often, recently, spend a lot → pamper them
- At risk: were good customers but haven't bought recently → recovery campaign
- Promising new: recent first purchase of good value → nurture them
- Dormant: haven't bought in a long time, low spending → evaluate if worth investing
Geographic analysis
Knowing where your products sell is fundamental for:
- Optimizing logistics and shipping costs
- Planning geo-targeted advertising campaigns
- Identifying areas with untapped potential
- Adapting offerings to local preferences
A dashboard with an interactive map lets you visualize sales, margins, and customers by geographic area with a single click.
Catalog optimization
BI helps you answer critical catalog questions:
- Which products to remove? Low sales + low margin + high return rate = elimination candidates
- Where to invest? High sales + high margin + low returns = products to promote
- Which categories are growing? Sales trends by category over 6-12 months
- Optimal pricing? Correlation between price changes and volume sold
Integration with e-commerce platforms
To work, BI must connect to your platform. The most common for SMEs:
- Shopify: most popular, with complete APIs for extracting orders, products, customers
- WooCommerce: WordPress-based, requires database connection or REST API
- PrestaShop: popular in Europe, with data export modules
- Magento: enterprise-grade, advanced APIs
Leviathan BI integrates with all these platforms, plus ERPs and custom management systems.
From data to decision: practical examples
Example 1: discovering a margin problem
The dashboard shows monthly revenue is on target, but margin has dropped 5%. Analyzing by product, you discover a supplier raised prices 15% on a category representing 30% of sales. Action: renegotiate or find an alternative supplier.
Example 2: recovering at-risk customers
RFM analysis identifies 200 customers who used to buy regularly but haven't ordered in 3 months. You launch a targeted email campaign with personalized discount codes. Result: 40 customers recovered, additional revenue of €12,000.
Example 3: optimizing ad campaigns
The channel dashboard shows Google Shopping has a 5.2x ROAS while Facebook Ads is at 1.8x. By reallocating 30% of budget from Facebook to Google, overall ROAS improves by 25%.
Related reading: Explore our sales KPIs guide, discover the best BI tools, and learn about cloud BI benefits for your shop.
Advanced customer segmentation and analysis
One of the most powerful analyses for e-commerce is customer segmentation. Instead of treating all customers the same, BI lets you divide them into groups based on purchasing behavior:
- RFM Analysis (Recency, Frequency, Monetary): identifies your best customers, those at risk of churning, and those to reactivate
- Value segmentation: top 20% of customers generating 80% of revenue
- Category segmentation: single-category vs cross-category customers (upsell opportunities)
- New vs returning: repurchase rate, average time between orders, lifetime value
With a BI tool, these segmentations update automatically and enable targeted actions: personalized email campaigns, specific promotions, alerts on declining customers.
For e-commerce marketing metrics, also check our guide to marketing KPIs.
Conclusion
E-commerce is a data-driven business by definition. Every click, every order, every interaction generates valuable information. Business Intelligence allows you to leverage this information to sell more, with better margins and more loyal customers.
If you want to see how BI can work for your e-commerce, try the free demo of Leviathan BI or contact us for personalized consulting.
Related articles
Sales Analysis for SMEs: A Practical 5-Step Guide
How to analyze your SME sales in 5 practical steps: from data collection to segmentation, from trend analysis to concrete actions. Method, tools, and ready-to-use templates.

Excel Data Analysis: When to Switch to BI
Excel is great for starting out, but it has clear limits. Discover when it's time to switch to Business Intelligence and how to do it smoothly in your SME.

What is Business Intelligence? A Complete Guide for SMEs
Discover what Business Intelligence is, how it works, and why it has become essential for small and medium businesses that want to grow with data.