
Marketing KPIs are the indicators that measure the effectiveness of your marketing activities — from website and SEO to social media, email campaigns, and online advertising. For SMEs, monitoring the right KPIs means knowing exactly where to invest your budget and where to cut.
In this guide, we cover the most important marketing KPIs, organized by channel, with realistic benchmarks for SMEs.
Why marketing KPIs are different from other business KPIs
Unlike traditional business KPIs (revenue, margins, cash flow), marketing KPIs have two unique characteristics:
- They're granular — you can measure the return on every single euro spent, by channel, campaign, and audience
- They're immediate — data arrives in real time or near-real time (unlike financial statements that arrive months later)
But this abundance of data is also the problem: Google Analytics alone offers hundreds of metrics. Which ones truly matter?
The 3 marketing KPIs every SME must track
Before diving into channel-specific details, here are the 3 universal marketing KPIs — the ones every SME needs, regardless of industry:
- CAC (Customer Acquisition Cost) — Total marketing spend / New customers acquired. Tells you how much it costs to acquire a customer. If CAC exceeds the margin on the first order, you're investing at a loss short-term.
- ROAS (Return on Ad Spend) — Revenue generated from campaigns / Ad spend. A 4:1 ROAS means for every euro spent, you earn 4 back. Below 2:1, the campaign isn't sustainable.
- Overall Conversion Rate — Leads or customers / Total visitors. The KPI that connects marketing to sales. If you generate lots of traffic but few conversions, the problem isn't visibility but the offer or the website.
Marketing KPIs by channel
Website and SEO KPIs
- Organic traffic — visitors arriving from Google without paying. The only SEO KPI that truly matters, because it's free and compounds over time
- Target keyword rankings — how many relevant keywords you rank in the top 10. You don't need to be first for everything: top 5 for 20 relevant keywords is better
- Bounce rate — % of visitors who leave after one page. Above 70% for landing pages indicates a content/audience relevance problem
- Average time on page — indicates whether content is actually being read. For a blog post, under 1 minute is a negative signal
- Organic conversion rate — organic visitors who take action (essential for e-commerce) (form, purchase, contact). The true ROI of SEO
Paid campaign KPIs (Google Ads, Meta Ads)
- CPC (Cost Per Click) — how much you pay per click. Varies enormously by industry: B2B ranges from €0.50 to €5+
- CTR (Click-Through Rate) — clicks / impressions × 100. For Google Search Ads, below 3% indicates the ad isn't relevant
- CPA (Cost Per Acquisition) — cost per lead or customer acquired from the campaign. It's CPC divided by conversion rate
- Quality Score (Google Ads) — ad quality score. Above 7/10, Google charges you less per click
- ROAS per campaign — attributed revenue / campaign spend. Compare campaigns against each other to allocate budget to top performers
Email marketing KPIs
- Open rate — % of emails opened. B2B SME benchmark: 20-25%. Below 15% indicates deliverability or subject line issues
- Click rate — % of emails with at least one click. Benchmark: 2-5%. Measures content effectiveness
- Unsubscribe rate — % of unsubscribes per send. Above 0.5% indicates you're sending too frequently or irrelevant content
- Revenue per email — revenue generated / emails sent. The definitive email marketing KPI
Social media KPIs
- Engagement rate — (likes + comments + shares) / followers × 100. For SMEs on LinkedIn: above 2% is good
- Organic reach — how many people see your posts without sponsorship. Declining across all platforms: Facebook today is below 5% of followers
- Website clicks — traffic generated from social to your site. The only social KPI that matters for business (likes don't pay the bills)
- Social conversion rate — social visitors who take action. Often low (1-2%), but valuable for remarketing
How to build a marketing KPI dashboard
Marketing data lives across separate platforms: Google Analytics, Google Ads, Meta Business Suite, Mailchimp, your CRM. The first step is unifying them.
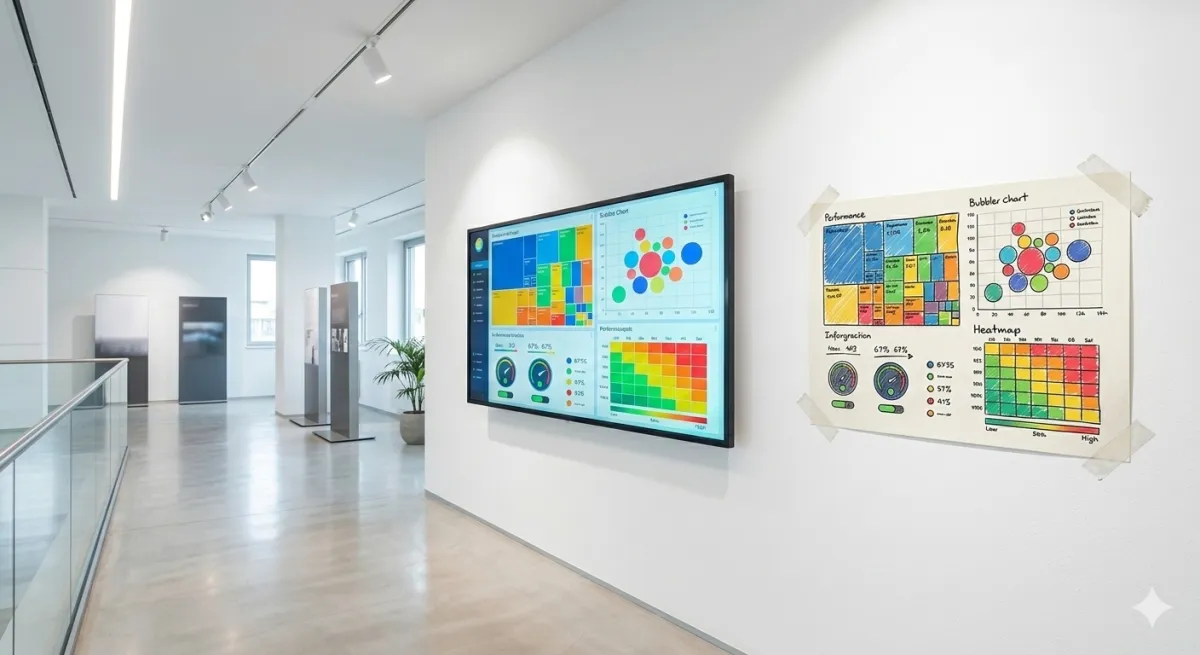
A Business Intelligence dashboard centralizes all marketing KPIs in a single view, integrating them into automated business reporting. With Leviathan BI, you can connect Google Analytics, your CRM, and advertising platforms to see the complete funnel: from first visit to sale.
The ideal marketing dashboard for an SME has 3 sections:
- Overview — through proper data visualization: CAC, overall ROAS, conversion rate, month-over-month trends
- By channel — performance comparison between SEO, ads, email, social
- ROI per campaign — which specific campaigns generate the most revenue per euro spent
Common marketing KPI mistakes
- Obsession with vanity metrics — followers, likes, impressions. They indicate visibility, not business. A post with 10 likes that generates 3 contacts is worth more than one with 500 likes and zero conversions
- Measuring channels in isolation — a user often discovers the brand on social, searches Google, receives an email, then converts. Multi-touch attribution is essential
- Not connecting marketing and sales — if your CRM doesn't communicate with marketing tools, you don't know if generated leads become paying customers
- Checking KPIs once a month — for paid campaigns, weekly is the minimum. For SEO, monthly is fine
Marketing KPIs: benchmarks for SMEs
| KPI | B2B SME Benchmark | B2C SME Benchmark |
|---|---|---|
| CAC | €50-200 | €10-50 |
| Google Ads ROAS | 3:1 - 5:1 | 4:1 - 8:1 |
| Website conversion rate | 2-5% | 1-3% |
| Email open rate | 20-25% | 15-20% |
| Bounce rate | <60% | <50% |
Note: these benchmarks are indicative and vary by industry, company size, and digital maturity.
Conclusion
Marketing KPIs aren't an academic exercise: they're the tool that lets you allocate every euro of budget to the highest-performing channel. Start with the 3 universal KPIs (CAC, ROAS, Conversion Rate), then add channel-specific ones as needed.
When marketing data is scattered across 5 different platforms, a centralized BI dashboard becomes indispensable. Contact us to see how Leviathan BI can unify your marketing KPIs in a single view.
Related articles
Data visualization: a guide to business charts for SMEs
Data visualization transforms raw numbers into immediate insights. Discover the 7 essential business charts, rules for effective visualizations, and mistakes to avoid.

Business KPIs: Performance Indicators Guide
Business KPIs are the indicators that measure your strategic goal achievement. Discover the 15 essential KPIs for every SME area and how to monitor them effectively.

Cost accounting for SMEs: practical guide 2026
Cost accounting tells you what you really earn per product, customer and project. Learn how to implement it in SMEs without drowning in Excel.