
Sales KPIs (Key Performance Indicators) are the numbers that tell you whether your business is selling well or if something needs fixing. But with dozens of metrics available, which ones truly matter for an SME?
In this guide, we analyze the essential commercial KPIs — a key subset of business KPIs —, how to calculate them, and — most importantly — how to use them to make decisions that grow revenue.
What are sales KPIs
A sales KPI is a measurable indicator that quantifies your company's commercial performance. It's not just a number: it's data that, when monitored over time, reveals trends, problems, and opportunities.
The difference between a growing company and a stagnating one often lies in the ability to measure the right things. Revenue alone isn't enough: you need to know where it comes from, how it changes, and what influences it.
The 10 essential commercial KPIs
1. Revenue
The most obvious, but no less important. Revenue should be monitored across multiple time horizons:
- Daily: to catch immediate anomalies
- Monthly: to evaluate medium-term performance
- Year-over-year: to understand real growth
How to use it: always compare with the same period from the previous year to eliminate seasonality.
2. Gross margin
How much you actually earn on every euro sold. Calculated as:
(Revenue - Cost of Goods Sold) / Revenue × 100
Growing revenue with declining margins is a warning sign. Maybe you're offering too many discounts or supplier costs have increased.
3. Average order value (AOV)
How much a customer spends on average per order:
Total revenue / Number of orders
How to use it: if AOV drops, consider upselling or cross-selling strategies. A 10% increase in AOV can have a huge impact on annual revenue.
4. Conversion rate
The percentage of contacts or visitors who become customers. It applies to different contexts:
- E-commerce: visitors → orders
- B2B: leads → customers
- Retail: store entries → purchases
A low conversion rate indicates problems in the sales process, pricing, or targeting.
5. New customer count
How many new customers you acquire each month. It's the engine of growth. If this number drops, future revenue is at risk, even if things are going well today.
6. Repurchase rate (Retention Rate)
How many customers come back to buy again. Keeping a customer costs 5-7x less than acquiring a new one:
Customers who repurchased / Total customers in period × 100
A high repurchase rate means the product satisfies and the customer relationship is solid.
7. Revenue per customer
How much each customer generates on average over a period:
Total revenue / Number of active customers
How to use it: identify high-value customers and understand what distinguishes them. Then replicate that model.
8. Average sales cycle
How long it takes from first contact to closing the sale. Especially in B2B, a long cycle can block cash flow.
How to use it: if the cycle lengthens, analyze where the process stalls. Maybe there's missing informational material, or follow-up is too slow.
9. Performance by salesperson/agent
In companies with a sales force, monitoring individual performance is crucial:
- Revenue per agent
- Number of visits vs orders generated
- Product mix sold
- Deviation from target
10. Budget variance
The comparison between actual results and planned targets:
(Actual revenue - Budget) / Budget × 100
Consistently negative variance indicates unrealistic targets or structural sales problems.
How to choose the right KPIs for your business
Not all these KPIs are relevant to every business. The choice depends on your business model:
| Business model | Priority KPIs |
|---|---|
| E-commerce | Revenue, AOV, conversion rate, repurchase rate |
| B2B with agents | Revenue per agent, sales cycle, new customers, budget variance |
| Retail | Revenue per location, average ticket, in-store conversion |
| SaaS / Subscriptions | MRR, churn rate, LTV, CAC |
Choose 5-7 KPIs and focus on those. A few well-tracked indicators beat twenty ignored ones.
Common KPI measurement mistakes
- Measuring without acting: KPIs are for making decisions, not decorating a dashboard
- Looking only at revenue: without margins, new customers, and retention, revenue is incomplete data
- No benchmark: a KPI without comparison (previous month, previous year, target) says nothing
- Manual updates: if you update KPIs manually in Excel — learn how to automate business reporting, you waste time and introduce errors
- Too many KPIs: if you have 30 indicators, you're not really monitoring anything
How to automate KPI monitoring
The most effective way to monitor KPIs is using a Business Intelligence system that connects directly to your data sources (ERP, e-commerce, CRM) and automatically updates dashboards.
With Leviathan BI you can:
- Connect your ERP or e-commerce in just a few hours
- View all commercial KPIs in customizable dashboards
- Receive alerts when a KPI drops below a critical threshold
- Automatically compare different time periods
- Share dashboards with your sales team
No technical expertise needed. Our team supports you through initial setup. Try the free demo or contact us to learn more.
Related reading: Learn how to implement BI in your SME or explore e-commerce specific metrics.
Related reading: Discover which BI tools to use for KPI monitoring and why to choose a cloud solution.
Sales forecasting: from KPIs to predictions
Monitoring KPIs is the first step. The second is using them for sales forecasting. A good BI system transforms historical data into reliable sales forecasts:
- Trend analysis: revenue projection based on the last 3-12 months' performance
- Seasonality: automatic identification of recurring peaks and dips (Christmas, sales, holidays)
- Pipeline forecast: for B2B, probability-weighted close rates on open deals
- Forecast vs actual: how accurate is your prediction? Error tracking improves forecasts over time
Sales forecasting doesn't require complex algorithms. For most SMEs, a weighted moving average on historical data — automatically calculated by BI — is already a huge step forward compared to "gut feelings" or manually updated spreadsheets.
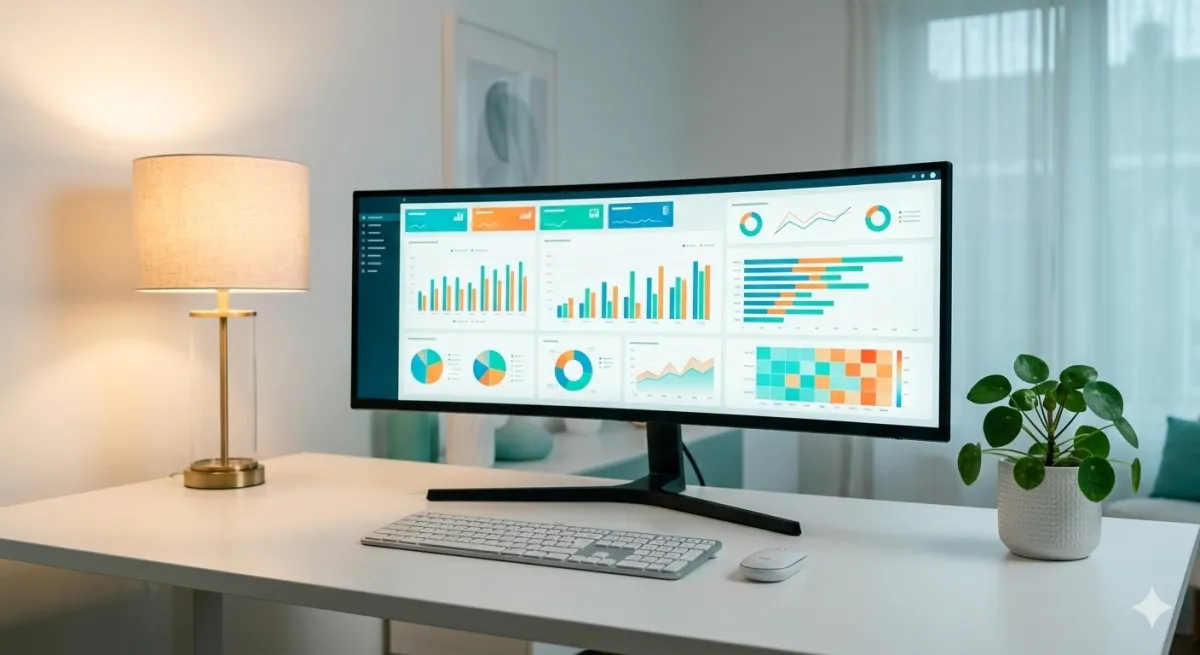
Sales dashboard: visualizing commercial KPIs
Monitoring sales KPIs is only useful if you can visualize them clearly and up-to-date. An effective sales dashboard shows in a single screen: revenue vs target, pipeline by stage, top customers, and weekly trends.
With a data visualization platform, ERP and CRM data automatically transforms into interactive charts — without updating Excel files every Monday morning.
Conclusion
Sales KPIs aren't just numbers: they're the most powerful decision-making tool available to an SME. Choose the right ones, monitor them consistently, and — most importantly — use the data to act. The difference between intuition and data-driven strategy is measured in revenue. For a deeper dive into structuring a complete sales analysis for your SME, read our 5-step guide.
Related articles

Business KPIs: Performance Indicators Guide
Business KPIs are the indicators that measure your strategic goal achievement. Discover the 15 essential KPIs for every SME area and how to monitor them effectively.
BI Dashboards: How to Build an Effective One
Learn what Business Intelligence dashboards are, which KPIs to monitor, and how to build effective dashboards for your business without technical skills.

Cost accounting for SMEs: practical guide 2026
Cost accounting tells you what you really earn per product, customer and project. Learn how to implement it in SMEs without drowning in Excel.